Trial-based tensors & time warping#
The warping module contains functions for constructing trial-based tensors. If the input is a TsGroup containing the activity of a population of neurons:
nap.build_tensorreturns a tensor of shape (number of neurons, number of trials, number of time bins) with padded values if unequal trial intervals.nap.warp_tensorreturns a tensor of shape (number of neurons, number of trials, number of time bins) with linearly warped time bins.
Both functions works for all time series object (Tsd, TsdFrame and TsdTensor) and timestamp objects (Ts and TsGroup). See examples below.
nap.build_tensor#
The function nap.build_tensor slices a time series object or timestamps object for each interval of an IntervalSet object and returns
a numpy array. The intervals can be of unequal durations.
tsgroup = nap.TsGroup({0:nap.Ts(t=np.arange(0, 100)+0.5)})
ep = nap.IntervalSet(
    start=np.arange(20, 80, 20), end=np.arange(20, 80, 20) + np.arange(2, 8, 2),
    metadata = {'trials':['trial1', 'trial2', 'trial3']}
    )
print(ep)
  index    start    end  trials
      0       20     22  trial1
      1       40     44  trial2
      2       60     66  trial3
shape: (3, 2), time unit: sec.
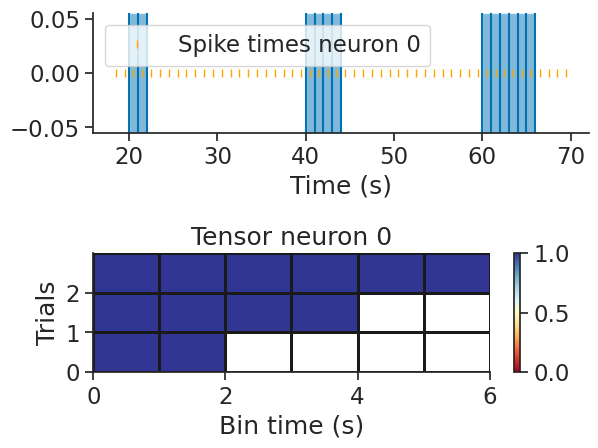
To build a trial-based count tensor from a TsGroup object with 1 second bins:
tensor = nap.build_tensor(tsgroup, ep, bin_size=1, padding_value=np.nan)

print(tensor)
[[[ 1.  1. nan nan nan nan]
  [ 1.  1.  1.  1. nan nan]
  [ 1.  1.  1.  1.  1.  1.]]]
We can check the operation by plotting the spike times and the edges of the bins for each epoch.

Note
This function is also available at the object level.
>>> tensor = tsgroup.trial_count(ep, bin_size=1, padding_value=np.nan)
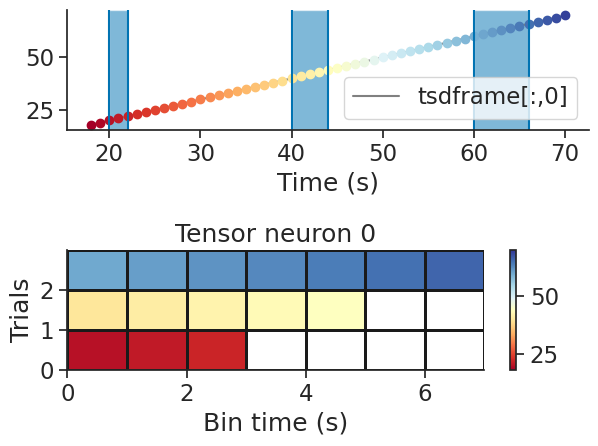
It is also possible to create a trial-based tensor from a time series. In this case the argument bin_size is not used.
tsdframe = nap.TsdFrame(t=np.arange(100), d=np.arange(200).reshape(2,100).T)
tensor = nap.build_tensor(tsdframe, ep)

print(tensor)
[[[ 20.  21.  22.  nan  nan  nan  nan]
  [ 40.  41.  42.  43.  44.  nan  nan]
  [ 60.  61.  62.  63.  64.  65.  66.]]

 [[120. 121. 122.  nan  nan  nan  nan]
  [140. 141. 142. 143. 144.  nan  nan]
  [160. 161. 162. 163. 164. 165. 166.]]]
Note
This function is also available at the object level.
>>> tensor = tsdframe.to_trial_tensor(ep, padding_value=np.nan)

nap.warp_tensor#
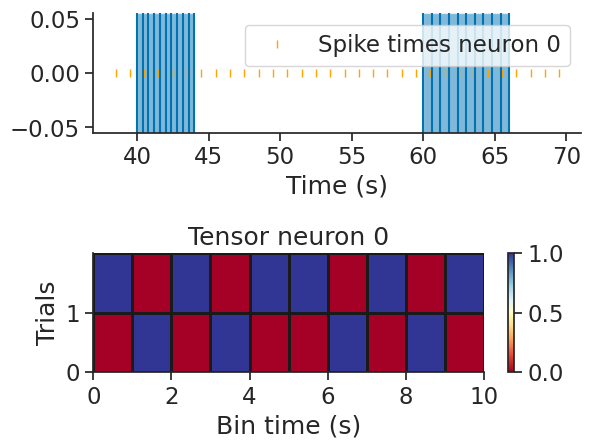
The function nap.warp_tensor is similar to build_tensor, but time is stretched linearly for each interval depending on
the parameter num_bins. In other words, the number of bins between the start and end of an epoch is always num_bins, but
the duration of each bin can vary across epochs.
tensor = nap.warp_tensor(tsgroup, ep, num_bins=10)

print(tensor)
[[[0. 0. 1. 0. 0. 0. 0. 1. 0. 0.]
  [0. 1. 0. 1. 0. 0. 1. 0. 1. 0.]
  [1. 0. 1. 0. 1. 1. 0. 1. 0. 1.]]]

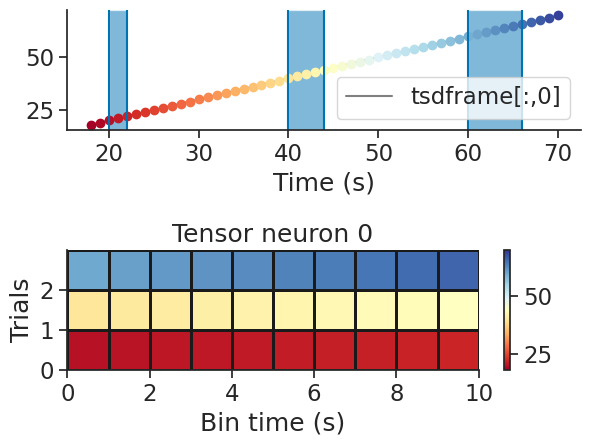
It is also possible to warp a time series to create a trial-based tensor. Under the hood, the time series is either bin-averaged or interpolated depending on the number of bins.
tensor = nap.warp_tensor(tsdframe, ep, num_bins=10)

print(tensor)
[[[ 20.          20.22222222  20.44444444  20.66666667  20.88888889
    21.11111111  21.33333333  21.55555556  21.77777778  22.        ]
  [ 40.          40.44444444  40.88888889  41.33333333  41.77777778
    42.22222222  42.66666667  43.11111111  43.55555556  44.        ]
  [ 60.          60.66666667  61.33333333  62.          62.66666667
    63.33333333  64.          64.66666667  65.33333333  66.        ]]

 [[120.         120.22222222 120.44444444 120.66666667 120.88888889
   121.11111111 121.33333333 121.55555556 121.77777778 122.        ]
  [140.         140.44444444 140.88888889 141.33333333 141.77777778
   142.22222222 142.66666667 143.11111111 143.55555556 144.        ]
  [160.         160.66666667 161.33333333 162.         162.66666667
   163.33333333 164.         164.66666667 165.33333333 166.        ]]]

